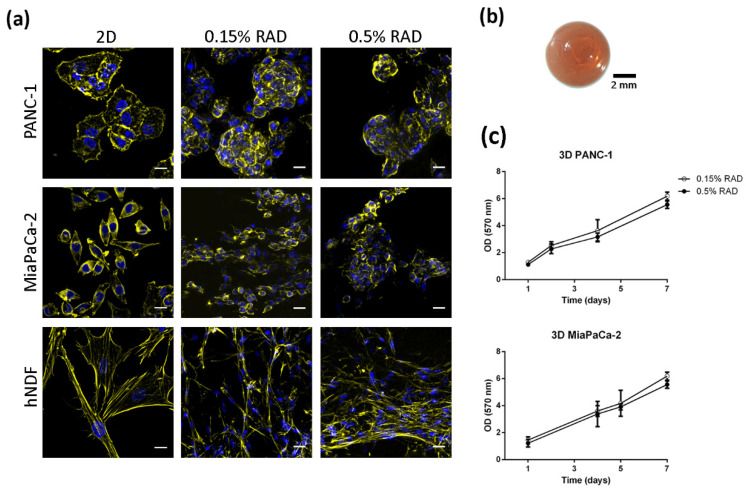
Figure 1.
Cell culture in 3D RAD16-I scaffolds. (a) Cell morphology in 2D and 3D cultures. Actin (Phalloidin, pseudo-colored in yellow) and nuclei (DAPI, blue) staining of PANC-1, MiaPaCa-2 and hNDF cells cultured in classic 2D dishes and RAD16-I 3D scaffolds at two different peptide concentrations. Scale bars represent 20 µm; (b) macroscopic view of 3D constructs stained with Congo red for clearer visualization; (c) growth curves of PANC-1 and MiaPaCa-2 cells in 0.15% and 0.5% RAD16-I.

