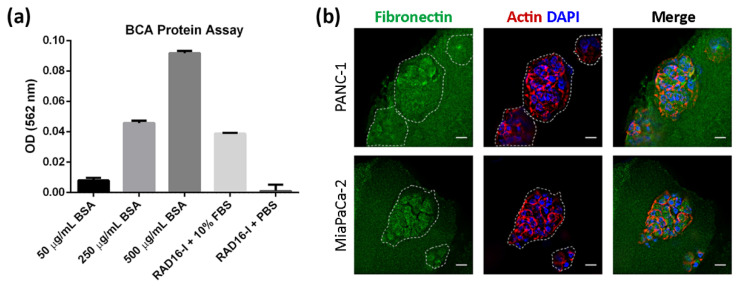
Figure 2.
Protein adsorbing into RAD16-I hydrogels. (a) BCA protein assay of RAD16-I gels. The graph shows the OD values obtained for known concentrations of protein (50 μg/mL−500 μg/mL BSA) and RAD16-I hydrogels assembled with 10% FBS or PBS; (b) fibronectin (green) immunofluorescence of PANC-1 and MiaPaCa-2 cells in RAD16-I 3D culture counterstained with phalloidin (red) and DAPI (blue). Scale bars represent 20 µm.

