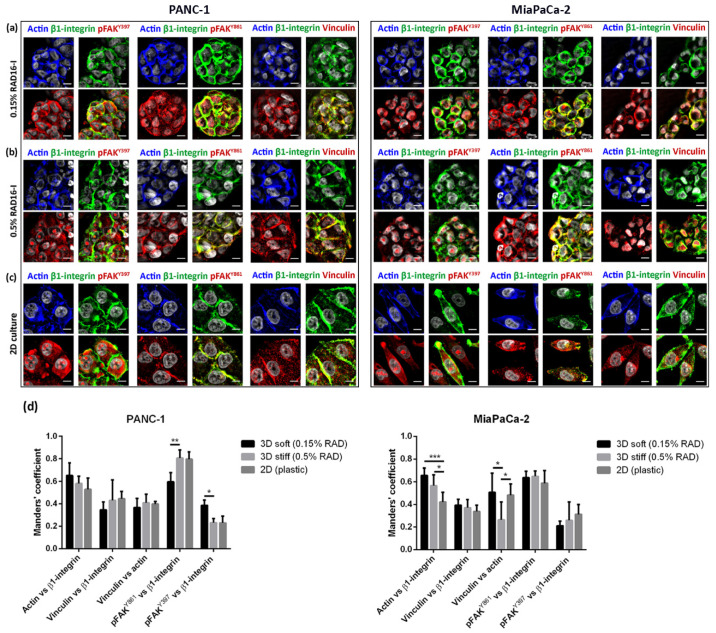
Figure 3.
Immunofluorescence analysis of signal mechanotransduction proteins. Actin (blue) β1-integrin (green), pFAKY397 (red), pFAKY861 (red) and vinculin (red) staining in PANC-1 (left) and MiaPaCa-2 (right) cells in (a) 0.15% RAD16-I; (b) 0.5% RAD16-I and (c) 2D cultures. Merge of green and red channels is also shown. Scale bars represent 10 µm; (d) Mander’s colocalization coefficients of PANC-1 and MiaPaCa-2 cells (n = 5). Statistical differences are indicated as * for p value < 0.05, ** for p value < 0.01 and *** for p value < 0.001.

