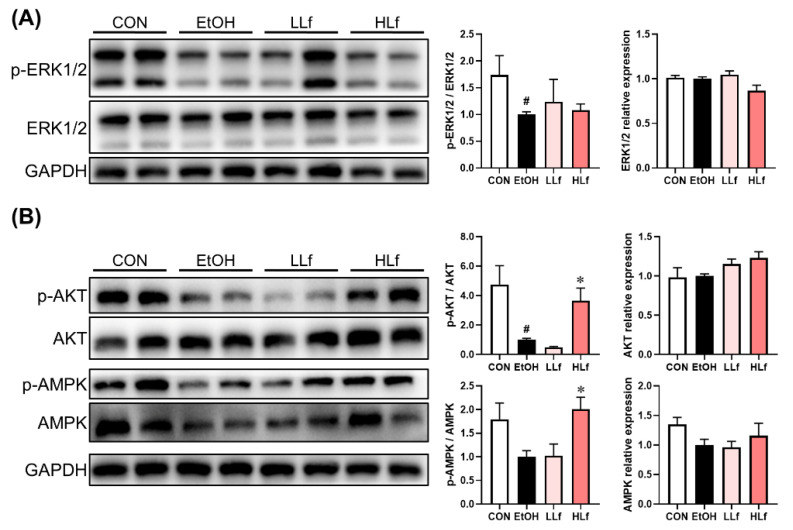
Figure 4.
Effects of Lf on protein expressions in redox-sensitive signaling pathways. (A) Effects of Lf on ERK1/2 protein expressions. (B) Effects of Lf on AKT and AMPK total protein and phosphorylation.CON, control group; EtOH, ethanol administration group; LLf, low-dose lactoferrin group; and HLf, high-dose lactoferrin group. Data are displayed as “mean ± SE”. n ≥ 6, for each group. # EtOH vs. CON, p < 0.05; * LLf or HLf vs. EtOH, p < 0.05.

