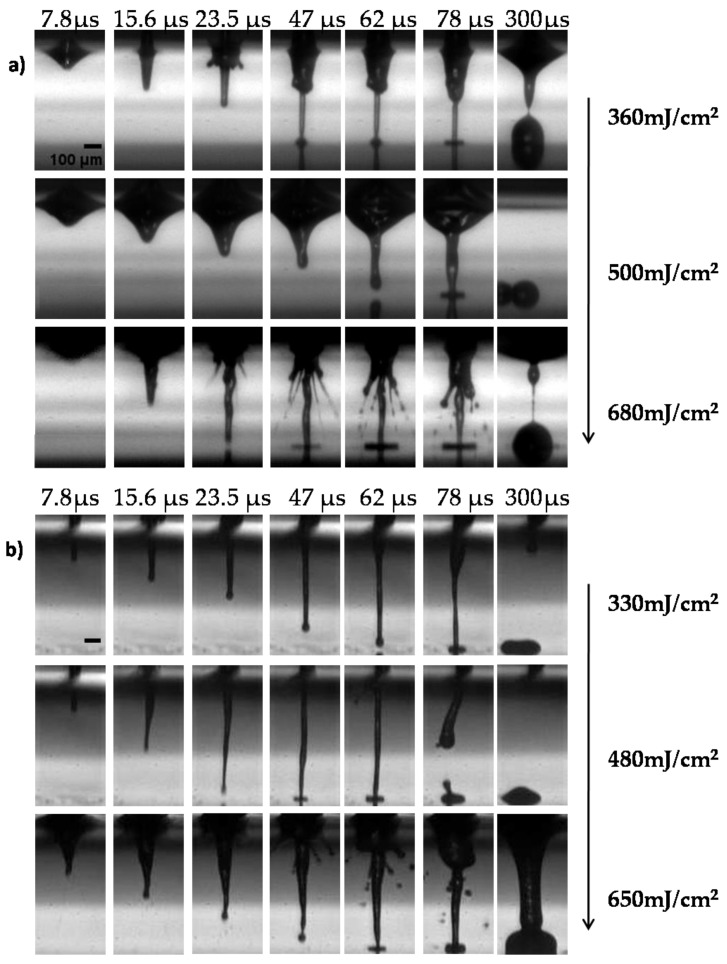
Figure 2.
Visualization of the jet dynamics induced by laser pulses with different wavelengths (a) at 532 nm and 0.6 ns pulse duration, and (b) at 355 nm and 10 ns pulse duration at different laser fluencies at the indicated timeframes. Representative images from each condition are depicted. All experiments were conducted in triplicates, n = 5 Scale bar 100 μm.

