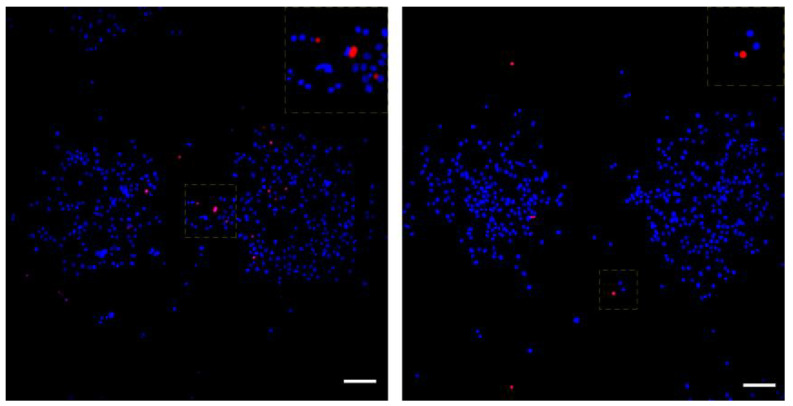
Figure 9.
Live-dead assay on printed MDA-MB-468 cells. Representative images of printed cells at 0 h (left) and 24 h (right). All cells were counterstained with DAPI (blue), while dead cells were also positive for PI (red). The insets on top right are enlargements of the squares in the center of each image with shifted overlay of the red channel (~10 μm) to the right to visualize the DAPI-stained nuclei underneath. Scale bars: 100 μm.

