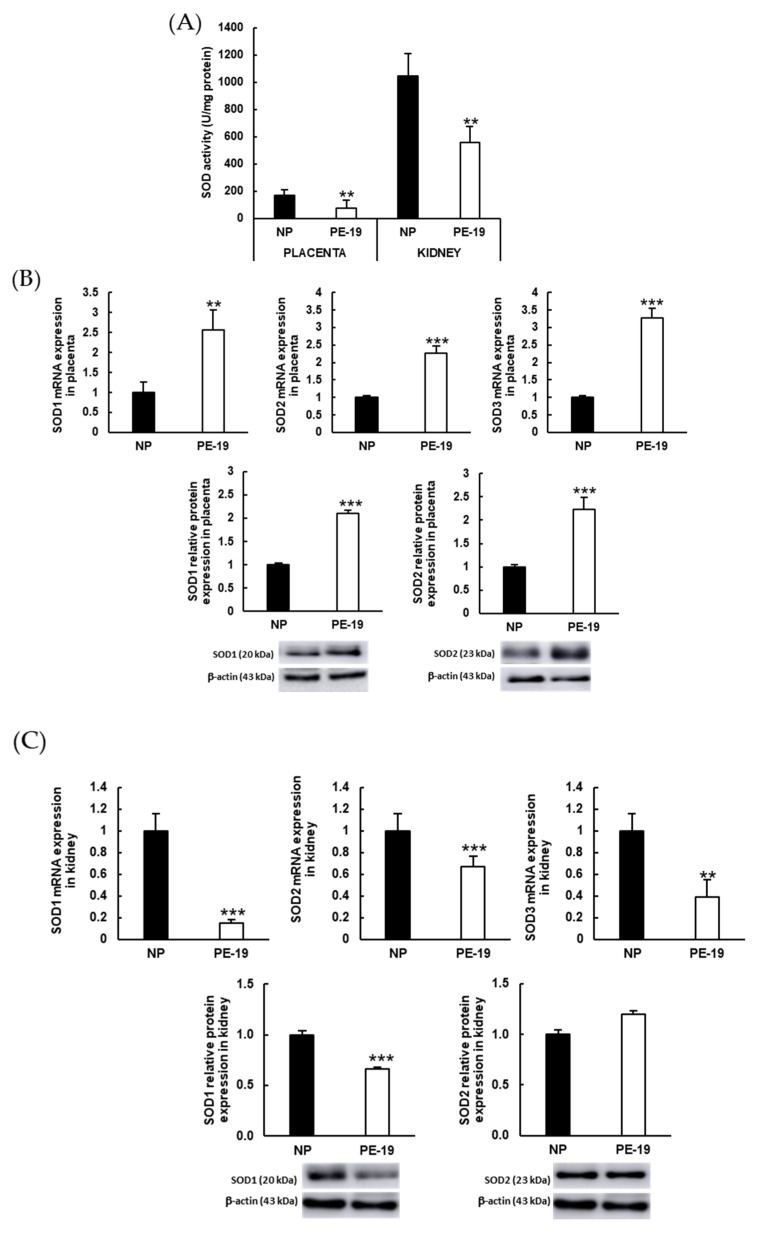
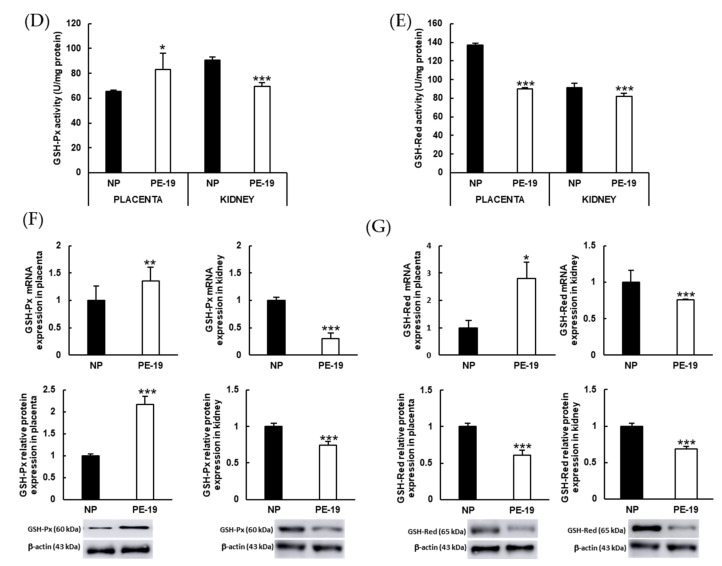
Figure 7.
Antioxidant enzyme activities and expressions in the placenta and kidney. (A) Superoxide dismutase activities in placental and renal cortex homogenates. (B,C) Gene (upper charts) and protein (lower charts) expressions of SOD isoforms (SOD1, SOD2, and SOD3) in the placenta and kidney, respectively. (D) Glutathione peroxidase (GSH-Px) and (E) glutathione reductase (GSH-Red) activities in placental and renal cortex homogenates. (F,G) Gene (upper charts) and protein (lower charts) expressions of GSH-Px and GSH-Red, respectively, in the placenta (left charts) and kidney (right charts). The quantitative fold changes in gene expressions were determined relative to the corresponding values for the glyceraldehyde-3-phosphate dehydrogenase (GAPDH) housekeeping gene. Values are expressed as mean ± SEM of at least six animals per group: * p < 0.05, ** p < 0.01, *** p < 0.001 vs. NP. NP: normal pregnant rats; PE-19: preeclamptic rats at GD19; U: enzyme units.


