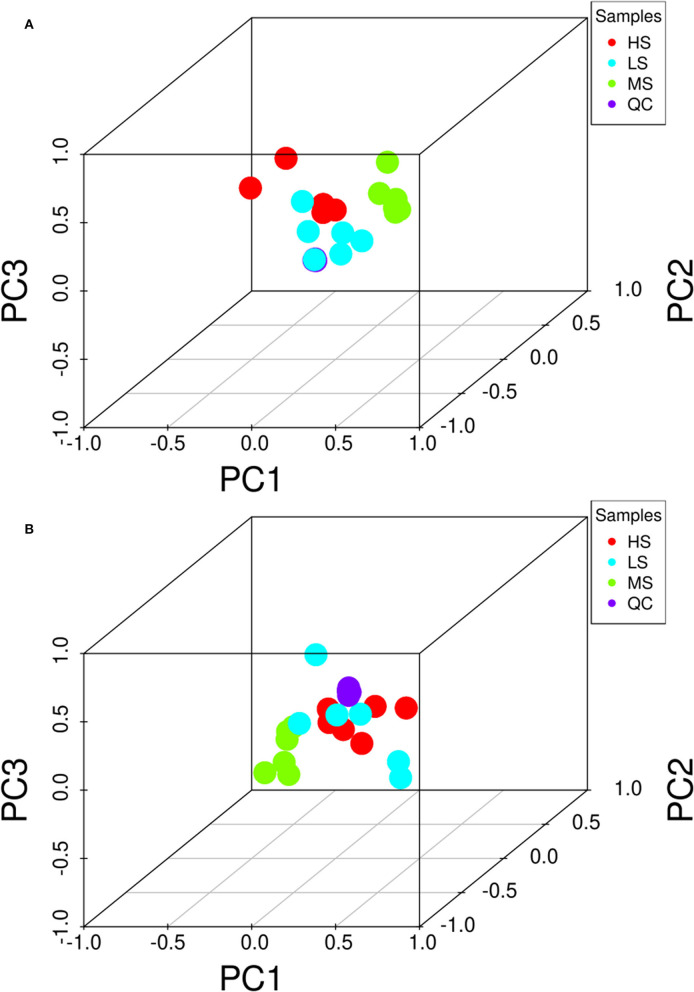
Figure 2.
3D PCA score of the overall samples in the positive (A) and negative (B) ion detection mode. The HS group is marked as red, the MS group is marked as green, the LS group is marked as blue, and the QC samples are indicated with purple. PC1 represents principal component 1, PC2 represents principal component 2, and PC3 represents principal component 3.

