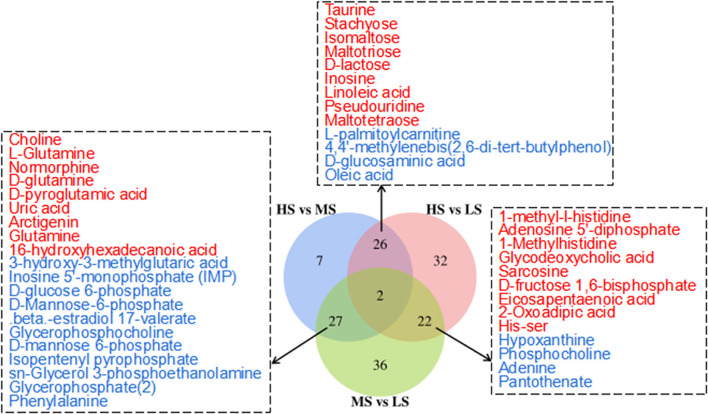
Figure 3.
Venn diagram illustrates the overlap of differential metabolites connected with the KEGG metabolic pathways among the three comparisons (HS vs. MS; HS vs. LS; MS vs. LS) in the longissimus lumborum of Tibetan sheep. The color red and blue represent the upregulation and downregulation of metabolites, respectively.

