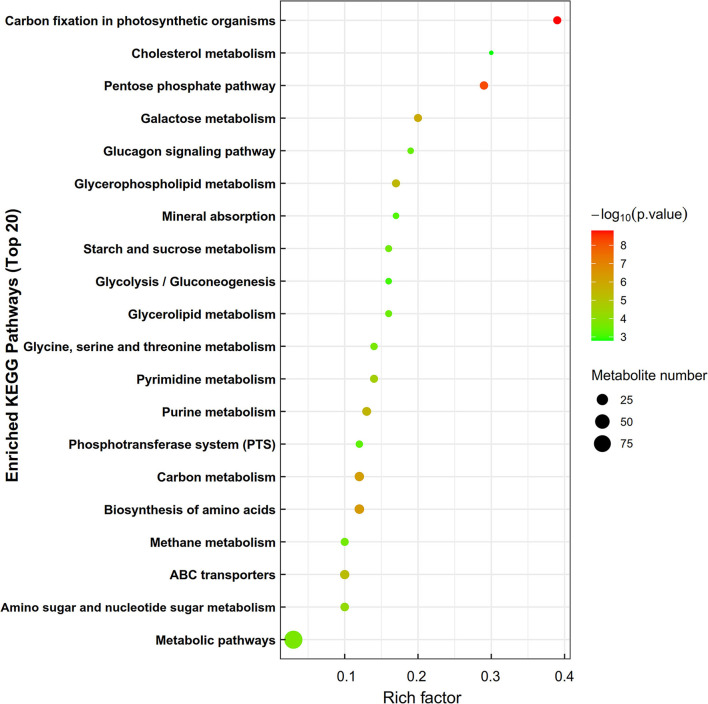
Figure 4.
The enrichment of KEGG metabolic pathways of differential metabolites in the longissimus lumborum of Tibetan sheep. In the bubble diagram, each bubble represents a metabolic pathway. The larger the bubble is, the greater the impact factor is; the darker the bubble is, the more significant the degree of enrichment is.

