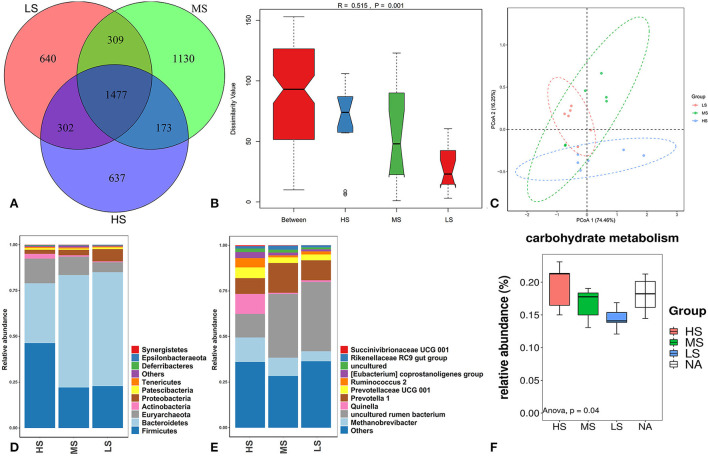
Figure 5.
OTUs Venn diagram of the overlap of rumen microbiota among the three groups (A). Anosim analysis (B) and PCoA plot (C) of the overall samples of rumen microbiota. Relative abundance of bacteria community proportion at the phylum (D) and genus (E) levels among the three groups. Boxplot of the prediction of the most important diff rumen function (F).

