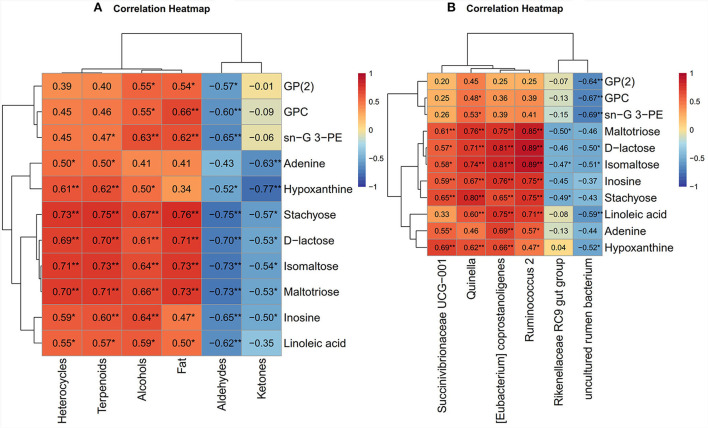
Figure 6.
(A) The correlation heat map between meat quality parameters and muscle metabolomics analysis. (B) The correlation heat map between muscle metabolomics analysis and rumen bacteria. The color red and blue represent positive and negative correlations, respectively. *P < 0.05 and **P < 0.01. G: glycerol; PE: phosphoethanolamine; GP(2): glycerophosphate(2); GPC: glycerophosphocholine.

