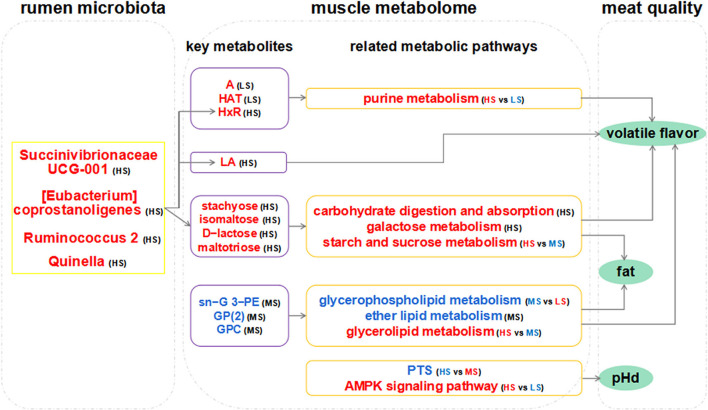
Figure 7.
Hypothesized scheme pathways and potential mechanisms related to the changes in rumen microbiota, muscle metabolome, and meat quality. Metabolites and bacteria in blue and red indicate them downregulated and upregulated significantly in each comparison, respectively. The gray line denotes the regulatory pathways of meat quality. A: adenine; HAT: hypoxanthine; HxR: inosine; PE: phosphoethanolamine; GP(2): glycerophosphate(2); GPC: glycerophosphocholine; LA: linoleic acid; G: glycerol. pHd: the extent of pH decline (within 24 h after slaughter).

