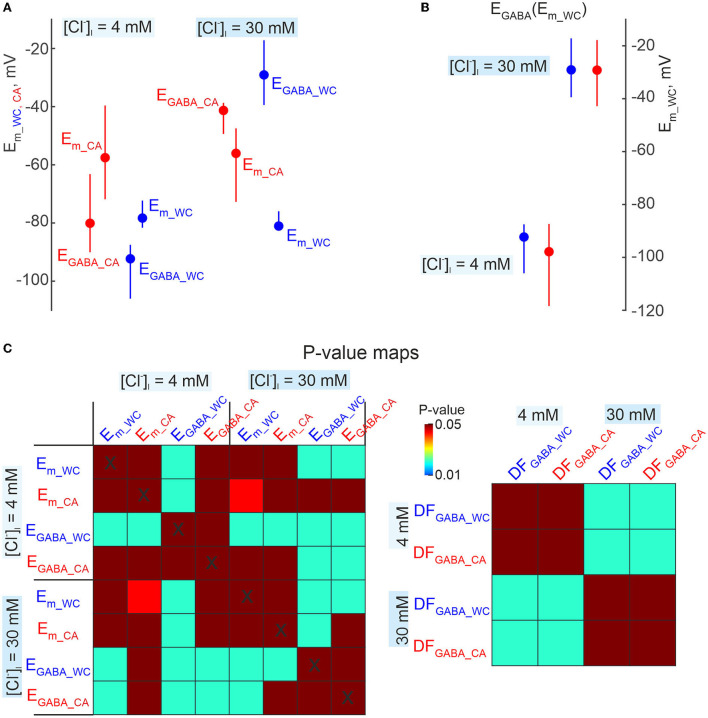
Figure 10.
Comparisons of EGABA derived from dual cell-attached and whole-cell recordings. (A) Summary plot of resting Em and EGABA obtained during CA and WC recordings of GABA-PSPs in CA1 pyramidal cells with [Cl−]i = 4 mM and 30 mM in the WC pipette solution. Note that EGABA values were calculated relative to Em values in CA and WC, respectively. The difference in resting Em values results in an apparent difference in EGABA estimates in CA and WC recordings. (B) EGABA values from the same dataset as in (A), recalculated as a function of Em in WC both for WC and CA data. This approach minimizes the error caused by a difference in Em values in CA and WC, and EGABA values in CA and WC show no difference at both [Cl−]i = 4 mM and 30 mM. (C) Corresponding p-value maps for all parameters shown in (A,B). The color of the cell at the row-column intersection shows the statistical significance (p-value) for the corresponding parameters. The dark red color corresponds to non-significant differences (p > 0.05), the other colors show different levels of significance of differences (p < 0.05) according to the color code (color bar on the right panel). (A–C) Pooled data from 8 pyramidal cells in the L5 somatosensory cortex of the mouse.

