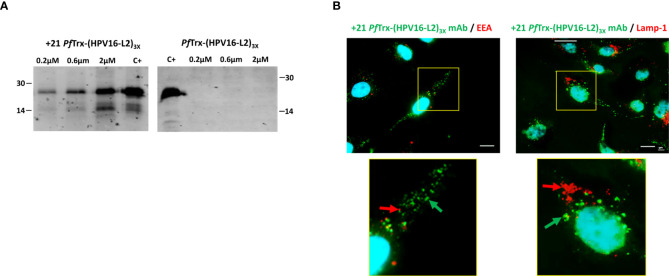
Figure 5.
Cell penetration capacity of the +21 PfTrx-(HPV16-L2)3x antigen. (A) HeLa cells were incubated for 4 hrs. at 37°C in the presence of increasing concentrations of +21 PfTrx-(HPV16-L2)3x or wt-PfTrx-(HPV16-L2)3x as indicated, and washed three times with 20 U/ml heparin. After cell lysis, the resulting soluble extracts were separately subjected to SDS-PAGE fractionation and the two PfTrx-(HPV16-L2)3x proteins were detected by immunoblotting using an anti-L2 monoclonal antibody (see ‘Materials and Methods’ for details). +21 PfTrx-(HPV16-L2)3x (left-side gel) and wt-PfTrx-(HPV16-L2)3x (right-side gel) were used as controls (C+) for the corresponding gel fractionation/immunoblot experiments; the migration positions and sizes (kDa) of two molecular weight markers used for gel calibration are shown on the left-side and the right-side of each gel image, respectively. (B) Immunofluorescence microscopy analysis of cell internalization and subcellular distribution of the +21 PfTrx-(HPV16-L2)3x antigen. Following incubation (4 hrs. at 37°C) of +21 PfTrx-(HPV16-L2)3x (0.1 µM) with Hela cells, and heparin-washing as in (A), the fusion protein was visualized with the use of a mAb directed against positively supercharged PfTrx (green-fluorescent spots, marked by green arrows). An additional antibody directed against Early Endosomal Antigen (EEA) was used for the experiments shown in the left-side panels to detect endosomes, which were visualized as red-fluorescent spots (marked by red arrows). An antibody directed against lysosomal-associated membrane protein 1 (LAMP-1) was used for the experiments shown in the right-side panels to detect lysosomes, which were visualized as red-fluorescent spots (marked by red arrows); also in this set of experiments, the +21 PfTrx-(HPV16-L2)3x protein was detected with a +21 PfTrx-specific mAb and visualized as green-fluorescent spots (marked by green arrows). Images shown in the bottom panels are magnified views of the yellow-boxed areas shown in the corresponding upper panels. Nuclei were stained with DAPI (blue) in all images. Scale bars represent 10 µm.

