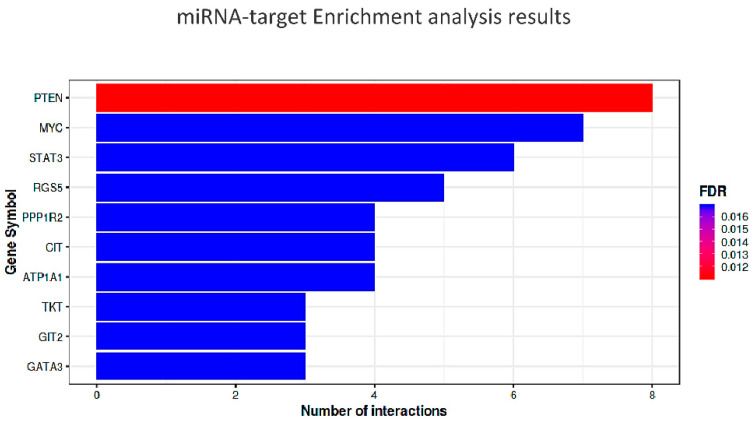
Figure 5.
Bar plot of the results of the enrichment analysis, obtained by using miTarBASE as reference dataset. In the Y-axis are reported the top ten target genes of the submitted miRNAs, while the X-axis represents the number of miRNAs targeting them. The color code reflects the adjusted p-values (FDR) increasing from red to blue. The threshold for the minimum number of miRNA-target interactions was set up to 2.

