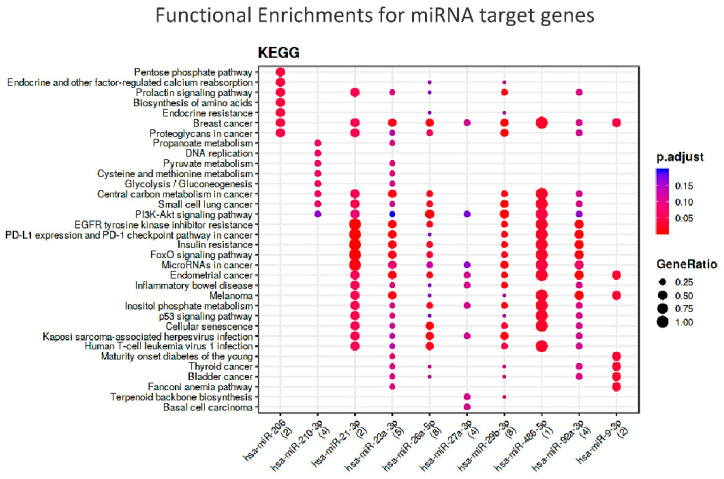
Figure 7.
Functional Enrichments for miRNA target genes according to KEGG db. N.B.: The colors of the dots represent the adjusted p-values (FDR), whereas the size of the dots represents gene ratio (i.e., the number of miRNA targets found annotated in each category over the total number of recognized targets indicated in round brackets).

