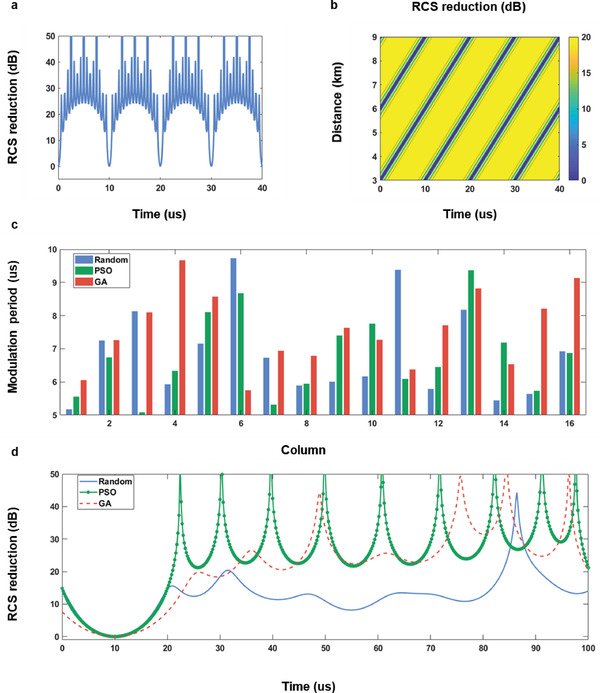
Figure 3.

a) The dependence of RCS reduction on the observation time at the distance of 3 km. b) The dependence of RCS reduction on the observation time and distance. c) The distributions of the modulation periods at different columns acquired through the random selection, and optimization algorithms—PSO, GA. d) The corresponding RCS reduction curves with the time at 3 km.
