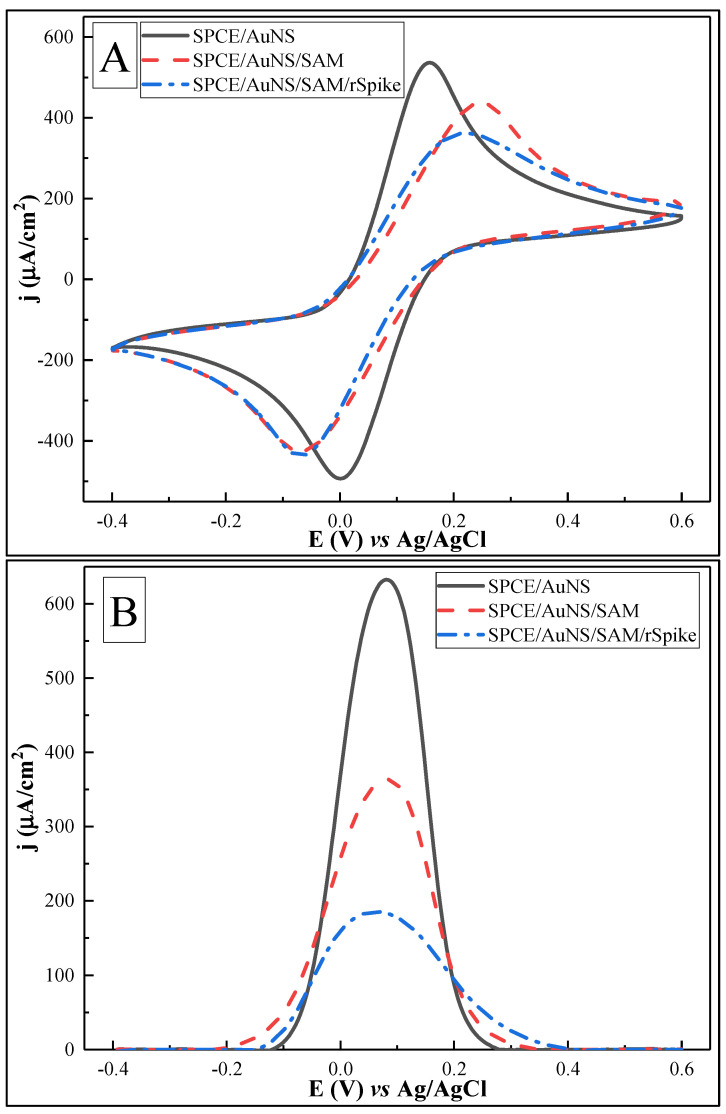
Figure 7.
Cyclic voltammograms (A) and differential pulse voltammograms (B) of SPCE/AuNS (—), after SPCE/AuNS/SAM formation (- - -), and for SPCE/AuNS/SAM/rSpike protein immobilization (-·-). Potential range was from −0.4 to +0.6 V, with a CV scan rate of 0.05 V/s, DPV step size of 0.004 V, pulse height of 0.05 V, pulse period of 100 ms, and pulse width of 50 ms, in 10 mM PBS, pH 7.4, containing 2 mM [Fe(CN6)]3−/4−. Signal normalized to the geometrical area of the working electrode (0.126 cm2).

