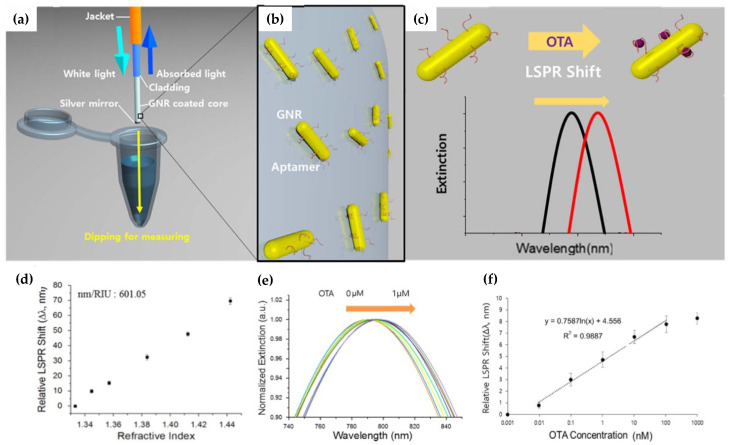
Figure 6.
Schematic of a tip OFB: (a) components and measurement procedure; (b) magnification of the sensor surface biofunctionalized with aptamer-modified GNR; (c) schematization of LSPR wavelength shift when the analyte, in this case, OTA, is recognized by the specific aptamer; (d) GNR-coated tip OFS response to RI; (e) LSPR wavelength shift with different concentrations of OTA, and (f) experimental response of the biosensor to different concentrations of OTA with respective linear fitting (images adapted with permission from ref. [53]. Copyright ©2018, with permission from Elsevier).

