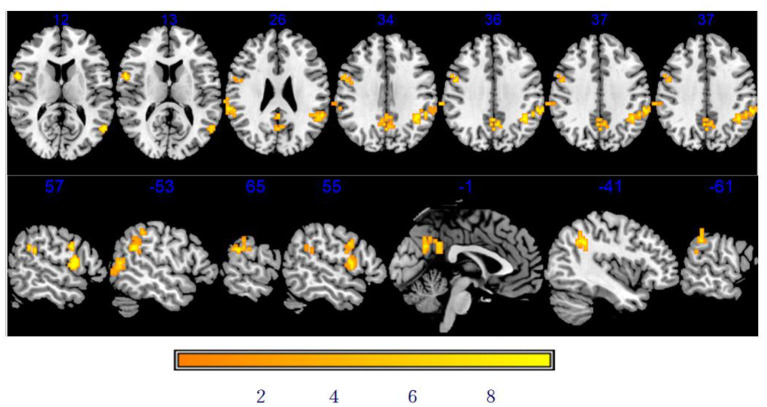
Figure 4.
Significant differences in DC between baseline and after stSCS in axial and sagittal slices. The warm colors indicate higher DC values at baseline and after stSCS (p < 0.05). Brain images are presented in radiology convention (the left of the figure represents the right side of the patient's brain and vice versa).

