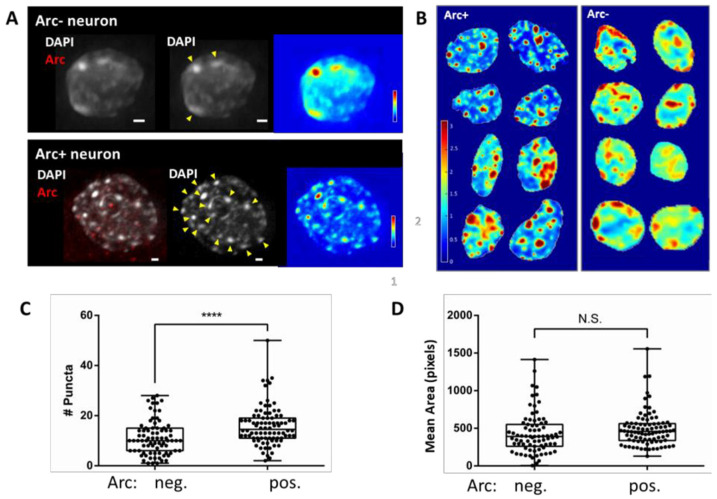
Figure 2.
Chromatin reorganisation in Arc-positive neurons. Arc expression was induced in a subset of cultured hippocampal neurons by a 4 h treatment with 4BF. Cells were fixed and stained for Arc (C7 antibody, Santa Cruz). DNA was labelled using DAPI. Z-stacks of DAPI images were obtained for neuronal nuclei that were positive and negative for Arc expression. Out-of-focus fluorescence was removed using 3D deconvolution (AutoQuant). (A) Max-projection images of a representative nucleus from an Arc-negative (top) and Arc- positive neuron (bottom). The white bar indicates a scale bar of 1 µm. DNA, labelled by DAPI, is shown in white while Arc expression is shown in red. Yellow arrowheads indicate DNA puncta. Heat maps of the relative DAPI intensity of the nucleus are shown in the rightmost panels. (B) DAPI heat maps for nuclei of 8 Arc-positive and 8 Arc-negative neurons. Relative DAPI intensity is shown by the colour scale on the left, which was the same for both panels. Whereas chromatin of Arc-negative neurons (right panel) was relatively homogenous (turquoise, green and yellow), Arc-positive neurons (left panel) were characterised by several areas of high DAPI intensity (red), indicating condensed heterochromatin (chromocenters)-separating domains with decondensed euchromatin (blue). (C,D) Puncta were quantified based on their size and intensity. Arc expression, measured as mean Arc intensity, was used to correlate with the properties of the puncta, generating the boxplots. Boxplots of number of puncta (C) and area of puncta (D) for Arc-negative and Arc-positive neurons. Each ● represents the (C) number or (D) mean area of puncta in a nucleus. A total of 167 nuclei were analysed from three sets of independent experiments. (C) Nuclei of Arc-positive neurons have a significantly higher number of puncta with 11.1 ± 0.8 puncta in Arc-negative nuclei and 15.9 ± 0.8 puncta in Arc-positive nuclei. **** indicates p-value < 0.0001, unpaired t test. (D) No significant change in area of puncta was observed: Arc-positive had an area of 488 ± 25 pixels, while the area of Arc -negative neurons was 431 ± 30 pixels (p = 0.15, unpaired t test). N.S. indicates not significant.

