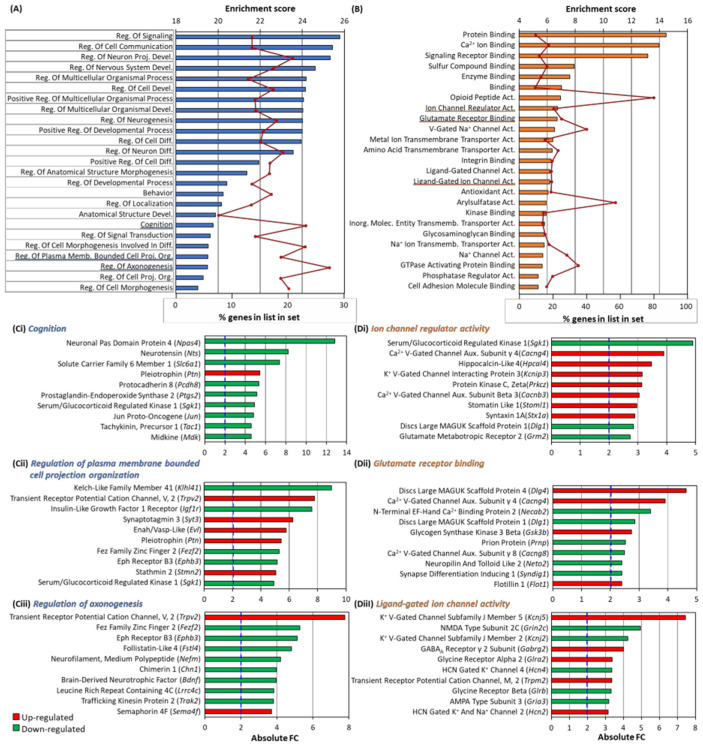
Figure 8.
GO analysis of Arc knock-down. (A,B) Gene set enrichment analysis was performed to investigate the biological processes (A) and molecular functions (B) that the altered genes were involved in. The enrichment score is plotted against the category names. The enrichment score is the negative natural logarithm of the enrichment p-value derived from Fisher’s exact test and reflects the degree to which the gen e sets are overrepresented at the top or bottom of the entire ranked list of genes. Bars indicate the enrichment score while the line graph indicates the percentage of genes that are altered under the respective GO term. The top 25 biological processes (A) and molecular functions (B) are shown. Many of the categories are related to synaptic plasticity (underlined blue and orange) [20,21]. (C,D) Bar-charts showing genes involved in the stated category from Biological Processes (Ci–Ciii) and Molecular Functions (Di–Diii) and their respective fold changes. The top 10 regulated genes are shown. Dotted blue line indicates an absolute Fold Change of 2.

