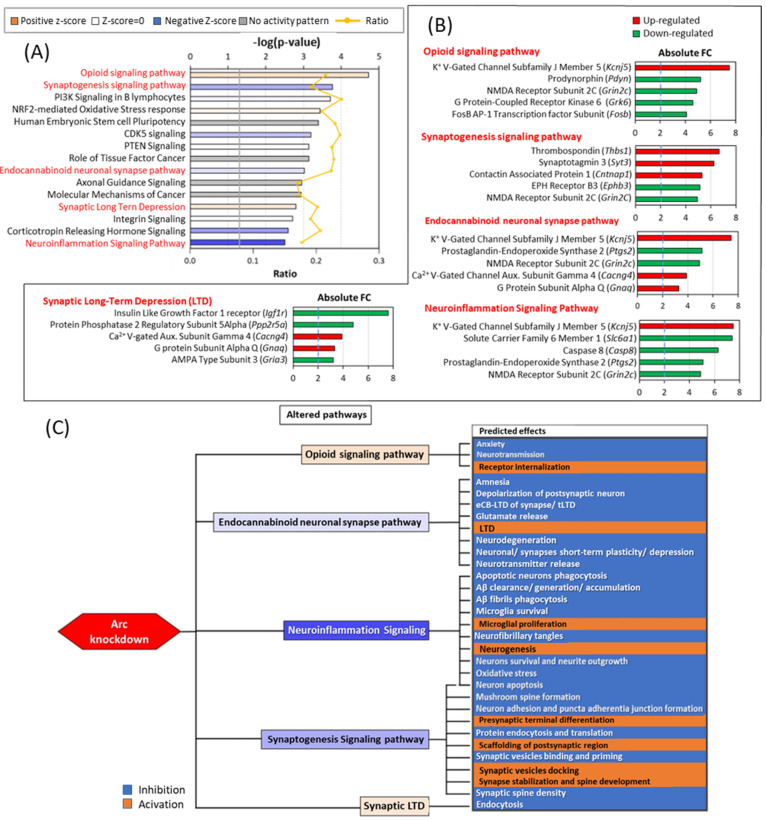
Figure 11.
Pathways altered by Arc knockdown. (A) Bar chart showing altered pathways identified by IPA. The orange line graph indicates the ratio of genes that were involved in the specified pathway. The grey line indicates threshold at p-value 0.05. The orange and blue bars indicate predicted activation and inhibition of pathways, respectively (determined by z-score). (B) Top 15 significantly altered pathways are shown. Pathways with predicted activation or inhibition of downstream effects are in red, further elaborated in panel C. The top 5 genes altered in the respective pathways are shown on the right and bottom of the alter ed pathway bar chart. (C) Diagram describing the predicted effects of the altered pathways. Five pathways are highlighted, and the downstream effects as predicted by IPA are listed.

