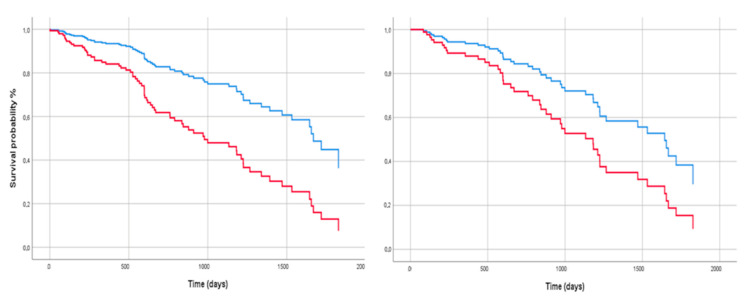
Figure 2.
Cox regression analysis for survival of study population, stratified according to gender (on the left; Male: red line) and basal FVC% of predicted value (on the right; FVC < 70% of predicted value: red line). The covariates are reported in Table 2.

