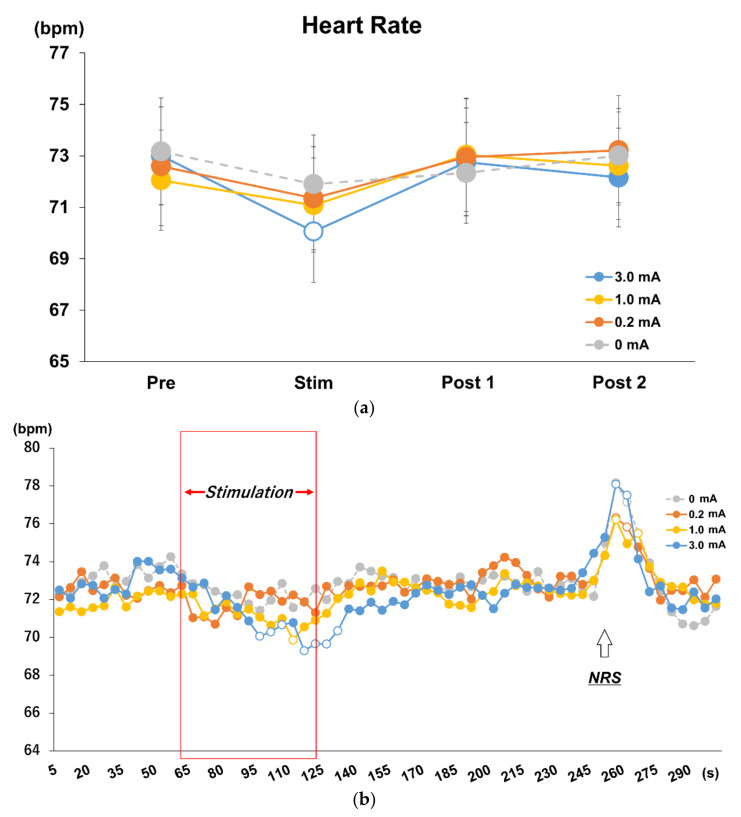
Figure 4.
(a) Effects of different stimulus intensities of tVNS on HR. Repeated measures two-way ANOVA revealed main effects and interactions for intensity and time factors (F = 1.951, p = 0.049). Post hoc analysis revealed a decrease in HR during stimulation only in the 3.0 mA condition compared to baseline (p = 0.005), Post 1 (p = 0.003), and Post 2 (p = 0.023). (b) Time course analysis on every 5 s in each stimulus intensity condition. Post hoc analysis using Dunnett’s method revealed different effects during stimulation for each stimulus current intensity, and rebound was observed during NRS administration 10 s after the end of Post 2 (shown as an upward-pointing arrow) rather than at the end of stimulation (p < 0.05). White dots indicate significant differences.

