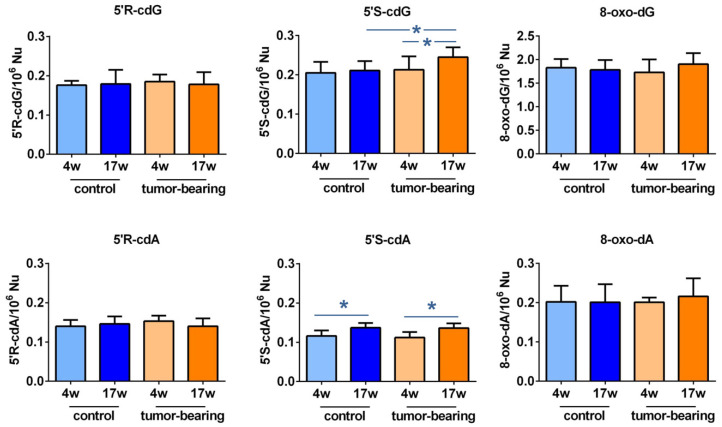
Figure 3.
Purine DNA lesions in the brain of SCID mice: the levels (lesions/106 nucleosides) of 5′R-cdG, 5′S-cdG, 5′R-cdA, 5′S-cdA, 8-oxo-dG, and 8-oxo-dA in the brain tissue of control SCID and tumor-bearing SCID mice. For specific values, see Tables S1 and S2. The values are given as mean ± SD (n = 6); * (p < 0.05).

