Figure 5.
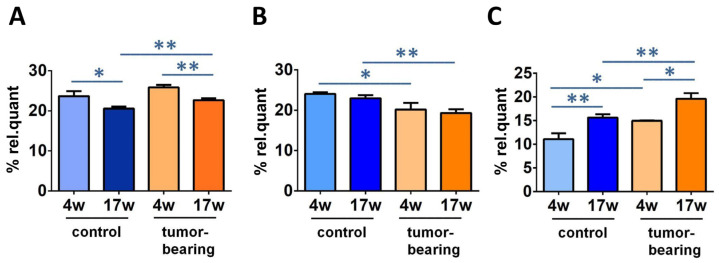
Some relevant fatty acid changes in SCID mice cohorts. Comparison of % rel. quant. of (A) C16:0; (B) 9c-18:1; (C) ARA in the brain tissue among control SCID mice and tumor-bearing SCID mice at 4 weeks of age and 17 weeks of age (for specific values, see Table 2). Significance: * (p < 0.05), ** (p < 0.01).

