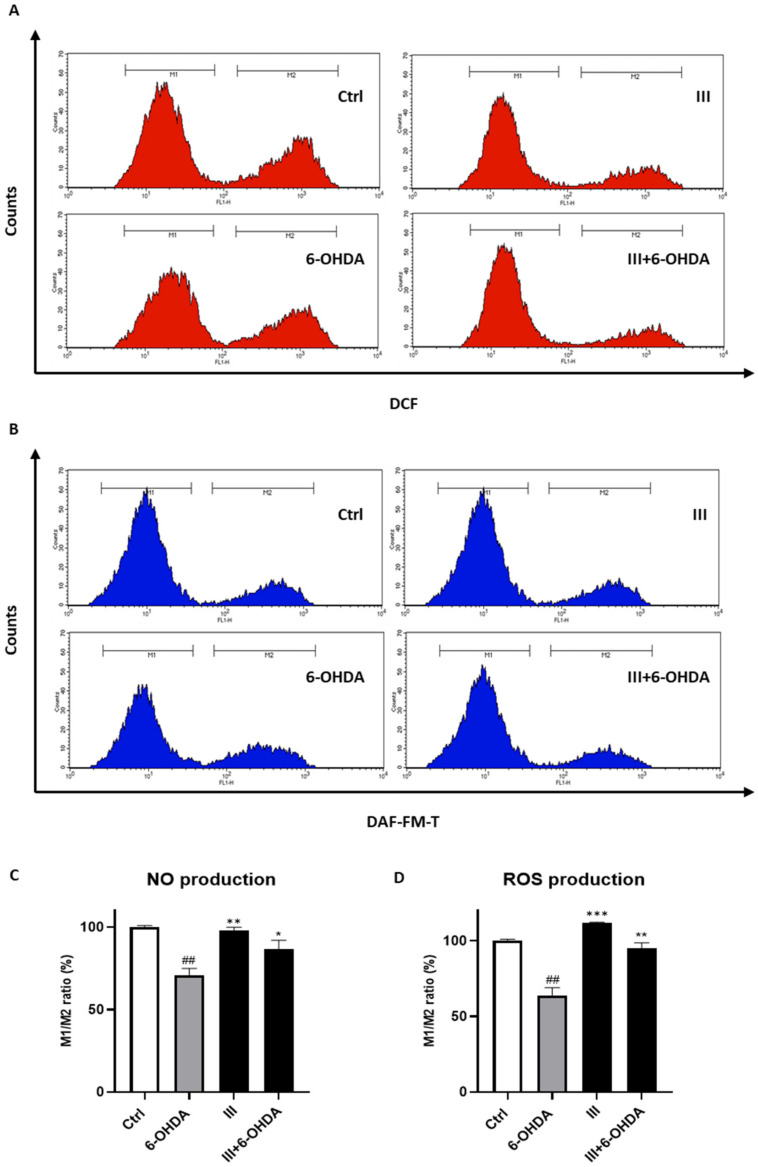
Figure 6.
Effect of fraction III (6 µg/mL) on ROS (A,D) and NO production (B,C), evaluated by DCFH-DA and DAF-FM, respectively, via cytofluorimetric analysis on SH-SY5Y cells treated with 6-OHDA (50 µM). Data are expressed as % of M1/M2 ratio (M1 = healthy population M2 = ROS/NO population). Results are showed as mean ± standard deviation (SD) from three independent experiments. ## denotes p < 0.01 vs. Ctrl; *, ** and *** denote respectively p < 0.05, p < 0.01 and p < 0.001 vs. 6-OHDA.

