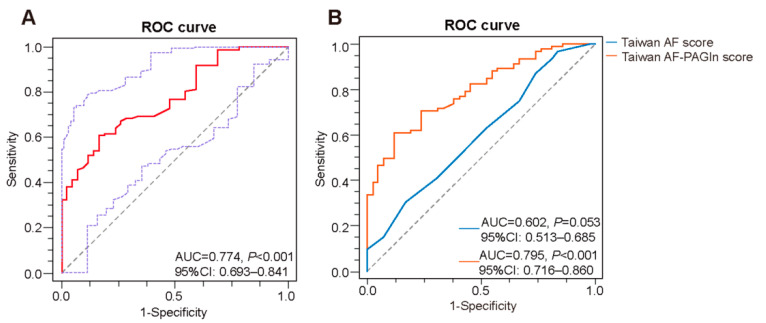
Figure 2.
Predictive potential of PAGln for AF. (A) ROC analysis on plasma PAGln in predicting presence of AF (AUC = 0.774, 95% CI: 0.693–0.841, p < 0.001). (B) ROC curve of the Taiwan AF score (blue) (AUC = 0.602, 95% CI: 0.513–0.685; p = 0.053) and Taiwan AF-PAGln score (orange) (AUC = 0.795, 95% CI: 0.716–0.860, p < 0.001).

