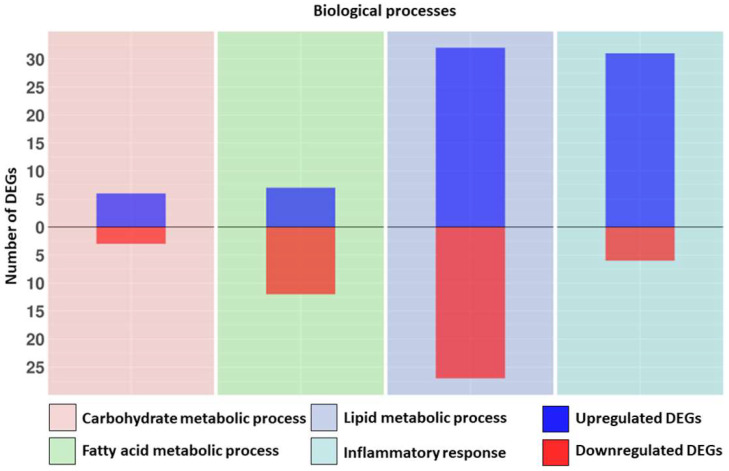
Figure 1.
Bar plot distributions of Differentially expressed genes (DEGs) related to the “Carbohydrate metabolic process”, “Fatty acid metabolic process”, “Lipid metabolic process” and “Inflammatory response”. Blue indicates the upregulated DEGs, and red indicates the downregulated DEGs for each biological process. The figure is split into four sections, one for each biological process.

