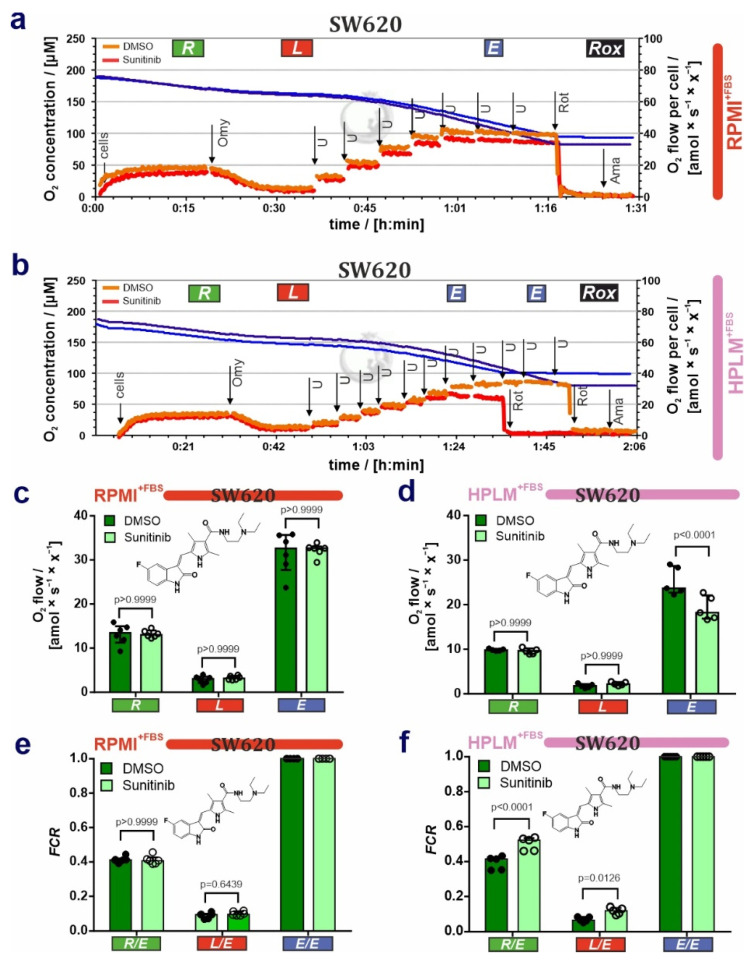
Figure 5.
Differential effects of sunitinib on cell respiration of SW620 cells grown in RPMI or HPLM. (a,b) Representative respiratory traces for coupling control protocol SUIT-003-D009 in SW620 cells grown in (a) RPMI+FBS and (b) HPLM+FBS, and exposed to 10 µM sunitinib for 3 h. Blue lines: O2 concentration [µM]; light orange lines: O2 flow per cell amol × s−1 × x−1 ] in DMSO control; and dark orange lines: O2 flow per cell [amol × s−1 × x−1] in sunitinib-treated cells. “x” represents the unit cell. (c,d) O2 flow (R, L, E) [amol × s−1 × x−1] baseline-corrected for Rox in (c) RPMI+FBS and (d) HPLM+FBS. (e,f) Flux control ratios FCR in SW620 cells grown in (e) RPMI+FBS and (f) HPLM+FBS and exposed to sunitinib (chemical structure depicted). Median ± IQR (50% range). 2-way ANOVA with Bonferroni´s multiple comparison test; N = 5–6.

