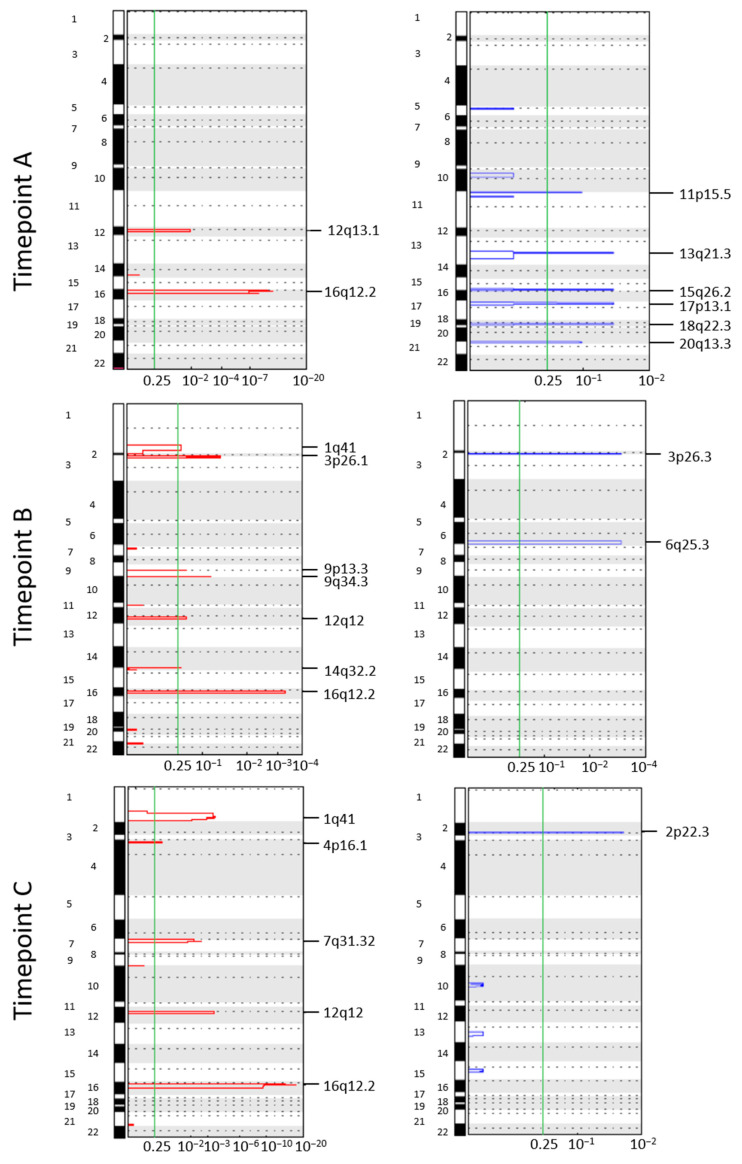
Figure 2.
Genomic Identification of Significant Targets in Cancer (GISTIC) amplification and deletion plots on single circulating tumor cells (CTCs) from patient CH29. Each column represents a different timepoint. The genome is oriented vertically from top to bottom, and the GISTIC q-values at each locus are plotted from left to right on a log scale. The green line represents the significance threshold (q-value = 0.25). A: basal (10 CTCs); B: screening (6–8 weeks after; 5 CTCs); C: end of therapy (13 CTCs).

