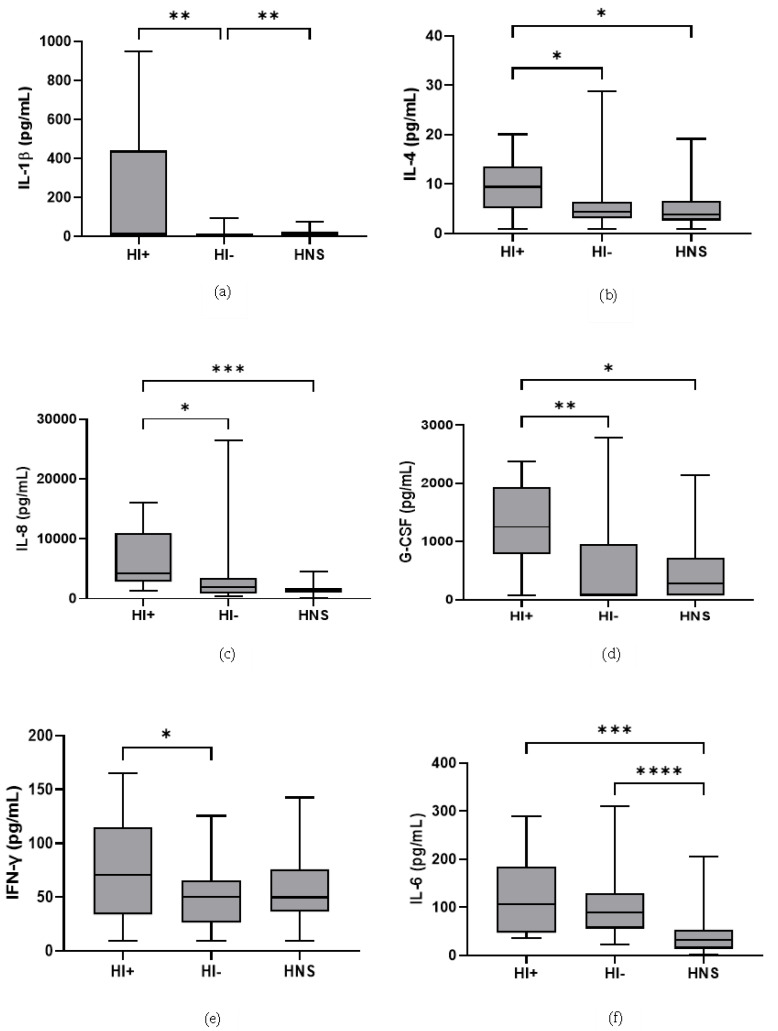
Figure 5.
Sputum Biomarkers in COPD HI+ve, COPD HI−ve and HNS: (a) IL-1β, data is presented as minimum, maximum and median concentrations, data analysed using Krushkal-Wallis test with Dunns post hoc test. ** p ≤ 0.01. (b) IL-4, data is presented minimum, maximum and median concentrations, data analysed using Krushkal-Wallis test with Dunns post hoc test. * p ≤ 0.05. (c) IL-8, data is presented as minimum, maximum and median concentrations, data analysed using Krushkal-Wallis test with Dunns post hoc test. * p ≤ 0.05, *** p ≤ 0.001. (d) Granulocyte colony stimulating factor (G-CSF), data is presented as minimum, maximum and median concentrations, data analysed using Krushkal-Wallis test with Dunns post hoc test. * p ≤ 0.05, ** p ≤ 0.01. (e) Interferon (IFN)-γ, data is presented as minimum, maximum and mean concentrations, data analysed using a one-way ANOVA test with Bonferroni post hoc test. * p ≤ 0.05. (f) IL-6, data is presented as minimum, maximum and median concentrations, data analysed using Krushkal-Wallis test with Dunns post hoc test. *** p ≤ 0.001, **** p ≤ 0.0001.

