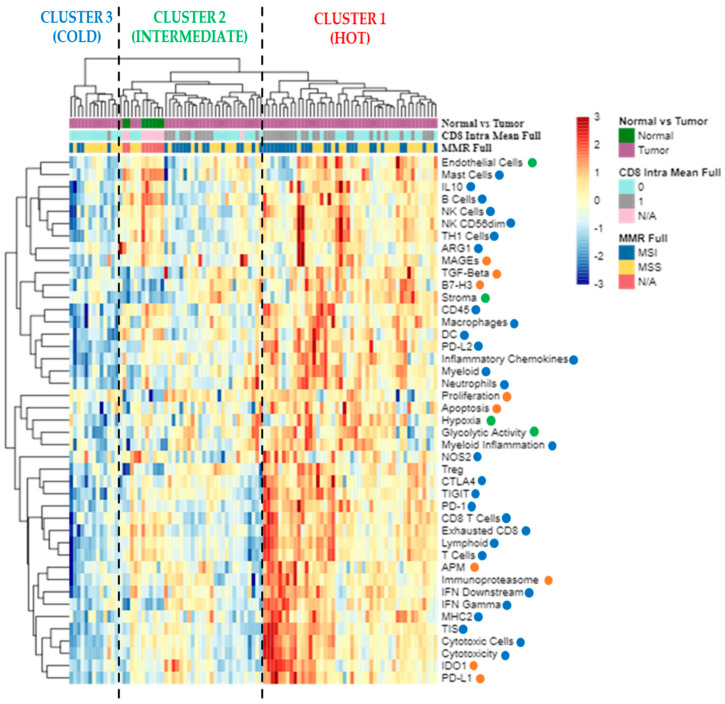
Figure 1.
The ‘All Signatures’ heatmap uses unsupervised hierarchical clustering to show relatedness among signature scores for each sample. Scores are scaled by signature to have a mean of zero and a standard deviation of one. The standardized signature scores are truncated at ±3 standard deviations to preserve greater clarity in color change within the largest proportion of data (99% of the data should fall within ±3 standard deviations of the mean). Sample annotations are listed at the top of the heatmap: tumor vs. normal samples (violet vs. green); CD8 positive (category 1) vs. CD8 negative (category 0) CRCs (grey vs. light blue); MSI vs. MSS tumors (dark blue vs. yellow). The signatures are displayed in rows and listed to the right of the heatmap: red dots correspond to tumor signatures, green dots correspond to microenvironment signatures, and blue dots correspond to immune response signatures. Each column is a unique sample. Orange dots: tumor signatures; green dots: tumor microenvironment signatures; blue dots: immune response signatures; N/A, not available data; MMR, mismatch repair status; MSI, microsatellite unstable; MSS, microsatellite stable.

