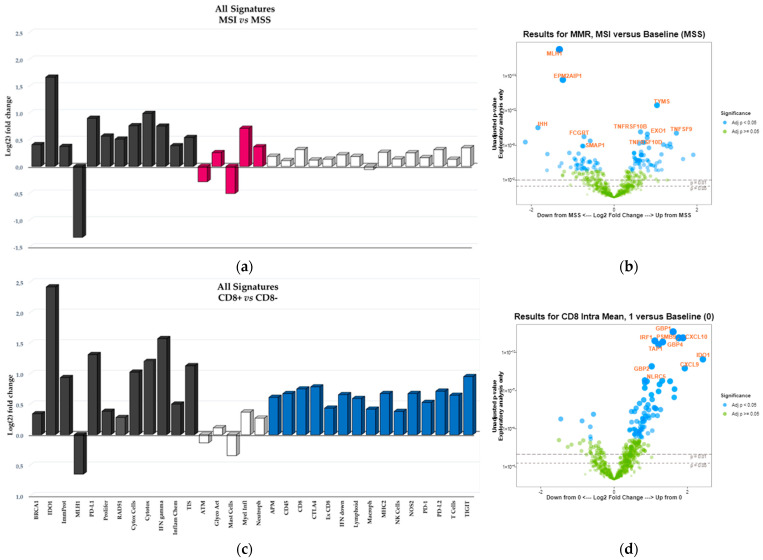
Figure 2.
‘All Signatures’ histograms display the 32 signatures that are overexpressed/downregulated in MSI versus MSS samples (a) and in CD8+ versus Cd8− samples (c). Differential expression versus the baseline group (MSS or CD8-, respectively) is reported on y-axis as signature’s Log(2) fold change. Black bars indicate those signatures that are significantly overexpressed/downregulated in both MSI and CD8+ groups; burgundy bars represent the signatures overexpressed/downregulated in just MSI group, blue bars indicate the signatures overexpressed/downregulated in just CD8+ group; white bars represent the signatures that are not differential expressed versus the baseline groups (p > 0.05). Volcano plot displays each gene’s fold change (or difference on the Log(2) scale) and significance (p-value) between MSI and MSS samples (b) and between CD8 positive (CD8+, category 1) and CD8 negative (CD8−, category 0) samples (d), represented along the x-axis, with the significance (p-value) along the y-axis. Genes that have greater statistical significance will produce points that are both larger and darker in hue, in addition to appearing higher on the plot. Genes that have greater differential expression versus the baseline group (MSS or CD8−, respectively) appear further from the center of the plot. Genes further to the right indicate an increase in expression, and signatures or genes further to the left indicate a decrease in expression relative to the baseline group. Horizontal lines indicate 0.01 and 0.05 p-values; blue dots indicate adjusted p-values lower than 0.05; green dots indicate adjusted p-values higher than 0.05.

