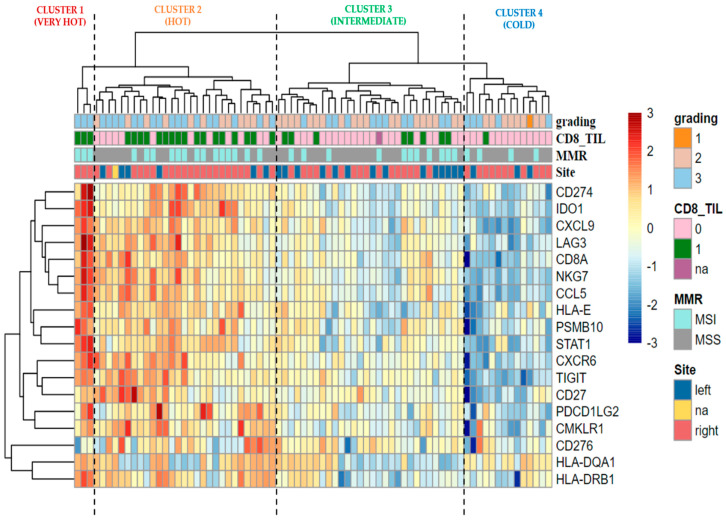
Figure 5.
The ‘TIS’ heatmap uses unsupervised hierarchical clustering to show relatedness among the 18 genes in TIS for each sample. Z-scores are calculated based on each gene to have a mean of zero and a standard deviation of one. The standardized signature scores are truncated at ±3 standard deviations to preserve greater clarity in color change within the largest proportion of data (99% of the data should fall within ±3 standard deviations of the mean). Sample annotations are listed at the top of the heatmap: grading; CD8 positive (category 1) vs. CD8 negative (category 0) CRCs (pink vs. green); MSI vs. MSS tumors (aquamarine vs. grey); anatomical site of onset left vs. right (blue vs. red). Na, not available data; MMR, mismatch repair status; MSI, microsatellite unstable; MSS, microsatellite stable.

