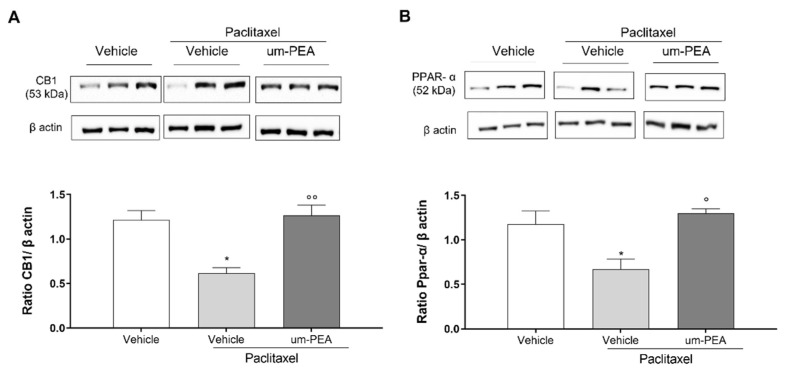
Figure 7.
Western blotting analyses for CB1 (A) and PPAR-α (B) receptors in spinal cords. Immunoblots representative of all tissues analyzed are shown. Densitometric analysis of protein bands are reported: the levels are expressed as the density ratio of target to control protein bands (β-actin). * p < 0.05 versus vehicle group; ° p < 0.05 and °° p < 0.005 versus PTX group. Values are expressed as mean ± SEM (n = 3). Differences were evaluated by ANOVA followed by Bonferroni’s post hoc test for multiple comparisons.

