Figure 4.
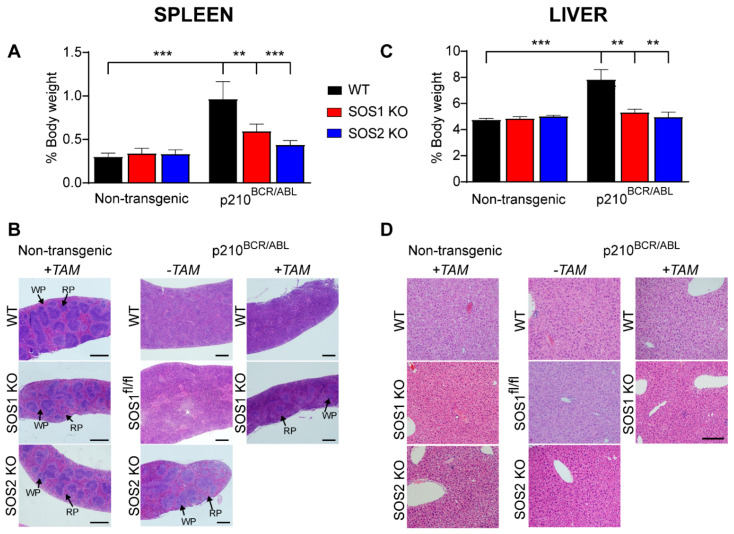
Suppression of CML-associated spleen and liver alterations in SOS1/2-KO/p210BCR/ABL transgenic mice. Analysis of the spleen (A,B) and the liver (C,D) of 9-month-old p210BCR/ABL transgenic and non-transgenic mice. (A,C) Bar plots representing the percentage of total body weight corresponding to the spleen (A) and the liver (C) of control, non-transgenic, and p210BCR/ABL transgenic mice of the indicated (color coded) SOS genotypes (WT, SOS1-KO, and SOS2-KO). Values represented are the mean ± S.E.M. n ≥ 6 for each genotype). **, p < 0.01; ***, p < 0.001. (B,D) Hematoxylin and eosin (H&E) staining of histological sections of the spleen (B) and the liver (D) of 9-month-old non-transgenic and p210BCR/ABL transgenic mice of the indicated genotypes. Where indicated, animals were fed with TAM-containing chow from the age of 6 months to induce the ablation of SOS1. Spleen red pulp (RP) and white pulp (WP) regions are indicated by arrows. Spleen scale bar: 500 μm; liver scale bar: 50 μm.

