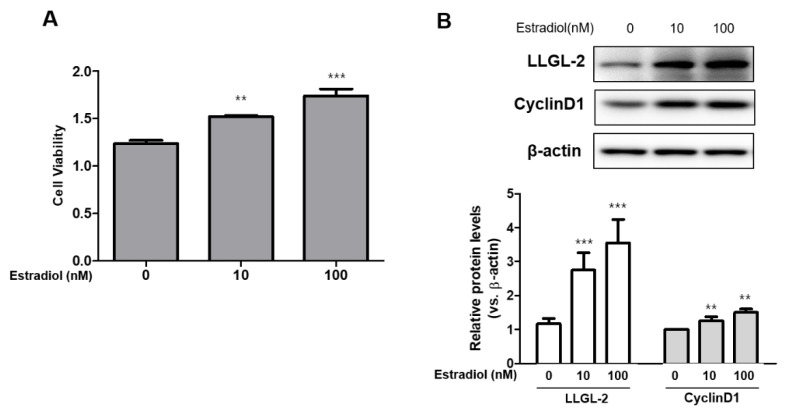
Figure 2.
LLGL2 expression and BPH-1 cell proliferation in E2-treated BPH-1 cells. (A) E2 treatment (0, 10, and 100 nM) increased viability of BPH-1 cells. (B) Western blot data showing up-regulated protein expression of LLGL2 and cyclin D1 after treatment with E2 (0, 10, and 100 nM) for 24 h. Graphical representation of the ratio of LLGL2 and Cyclin D1 to β-actin. Values are expressed as the means ± standard deviation; ** p < 0.01 and *** p < 0.001 versus E0 group.

