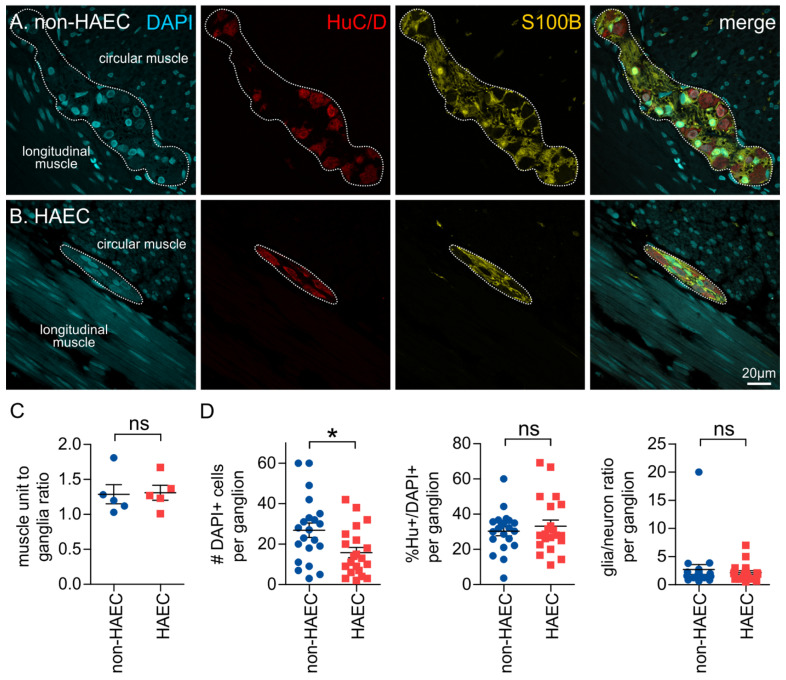
Figure 4.
Comparison of ganglia from the proximal normoganglionic tissue in non-HAEC and HAEC patients. (A,B) Representative images of ganglia from the patient groups, with immunohistochemistry performed against DAPI, HuC/D and S100B. Note: (C) Quantification of the muscle unit to ganglia ratio (ns: p > 0.05, Students’ t-test). (D) Quantification of the size of ganglia (#DAPI+ cells/ganglion, left), the proportion of neurons per ganglion (%Hu + /DAPI+, middle), and the ratio of glia/neurons per ganglion (right). non-HAEC: n = 21 ganglia, N = 4 patients; HAEC: n = 21 ganglia, N = 3 patients. * p = 0.0158, ns: p > 0.05, Students’ t-test.

