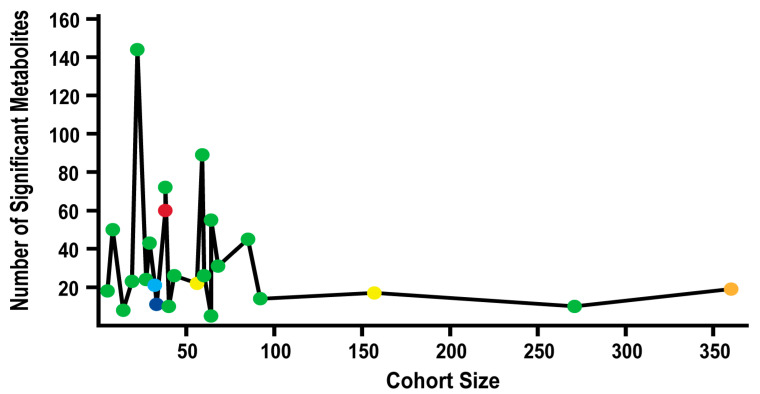
Figure 4.
Significant Metabolites, Cohort Size, and p-value. Line chart comparing cohort size and the number of metabolites identified as significantly changing. Circle colors correspond to p-value used in the study to identify statistical significance: p < 1 × 10⁻⁵ (dark blue), p < 0.001 (light blue), p < 0.01 (red), p ≤ 0.05 (green), p < 0.1 (orange), and p < 0.3 (yellow). One study was excluded since it did not report a p-value to determine statistical significance.

