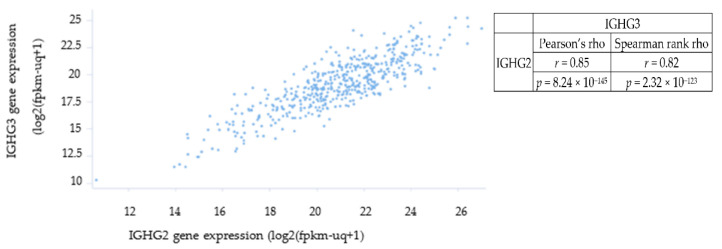
Figure 1.
IGHG2 and IGHG3 expression levels were examined in 571 CRC patient samples following RNA-seq (TCGA-COAD dataset). There was no evidence of a unique sub-population of patients with elevated IGHG3 expression within the CRC population. However, we did find a significant association between the levels of IGHG2 (x-axis) and IGHG3 (y-axis) expression suggesting the transcription of these constant regions have similar expression profiles in CRC patients (p = 8.25 × 10−145).

