Figure 5.
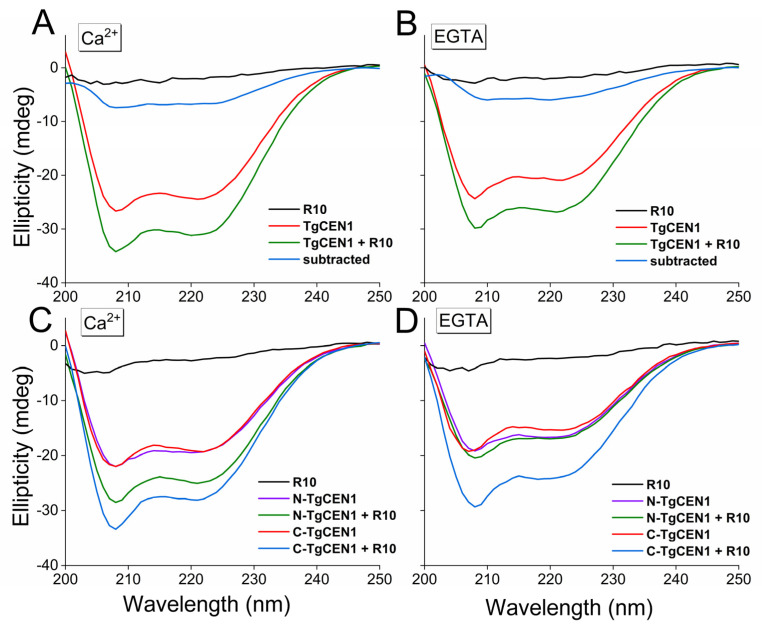
Far-UV CD analysis of R10 binding to intact TgCEN1 and its isolated domains in the presence of CaCl2 or EGTA. (A,B) Far-UV CD spectra of R10 peptide alone (black line), TgCEN1 (red line), and protein–peptide complex (green line) in the presence of (A) 5 mM CaCl2 or (B) EGTA. The CD spectrum resulting from subtraction of the spectrum of protein–peptide complex from that of protein alone was also shown (blue line). (C,D) Far-UV CD spectra of R10 peptide alone (black line), N-TgCEN1 (violet line), or C-TgCEN1 (red line), N-TgCEN1–peptide complex (green line) or C-TgCEN1–peptide complex (blue line) in the presence of (C) 5 mM CaCl2 or (D) EGTA. In all spectra, the same concentration of TgCEN1 (0.2 mg/mL) was used, and a 1:2 molar ratio of R10 peptide was added. For the single domains, the same concentration of N-TgCEN1 or C-TgCEN1 (0.2 mg/mL) was used, and a 1:1 molar ratio of R10 peptide was added. Increasing the peptide-to-protein ratio was not accompanied by obvious CD changes, in perfect agreement with the ITC-obtained stoichiometry.

