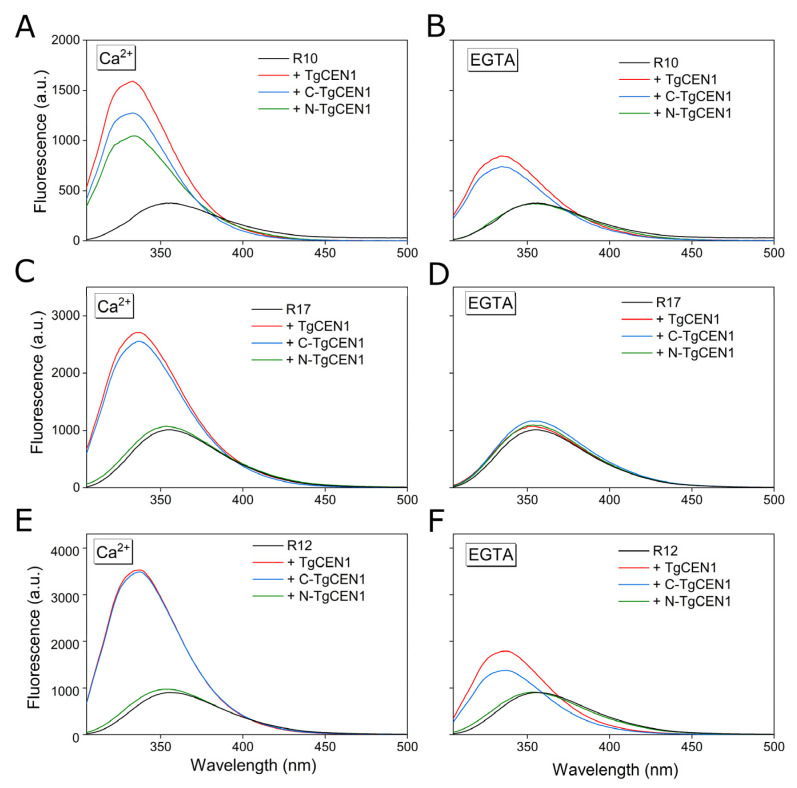
Figure 6.
Binding of TgCEN1 and its domains to the different peptides in the presence of CaCl2 or EGTA measured by Trp fluorescence. Trp fluorescence emission spectra of peptide alone (black line), and upon addition of intact TgCEN1 (red line), C-TgCEN1 (blue line), or N-TgCEN1 (green line) in the presence of CaCl2 (A,C,E) or EGTA (B,D,F).

