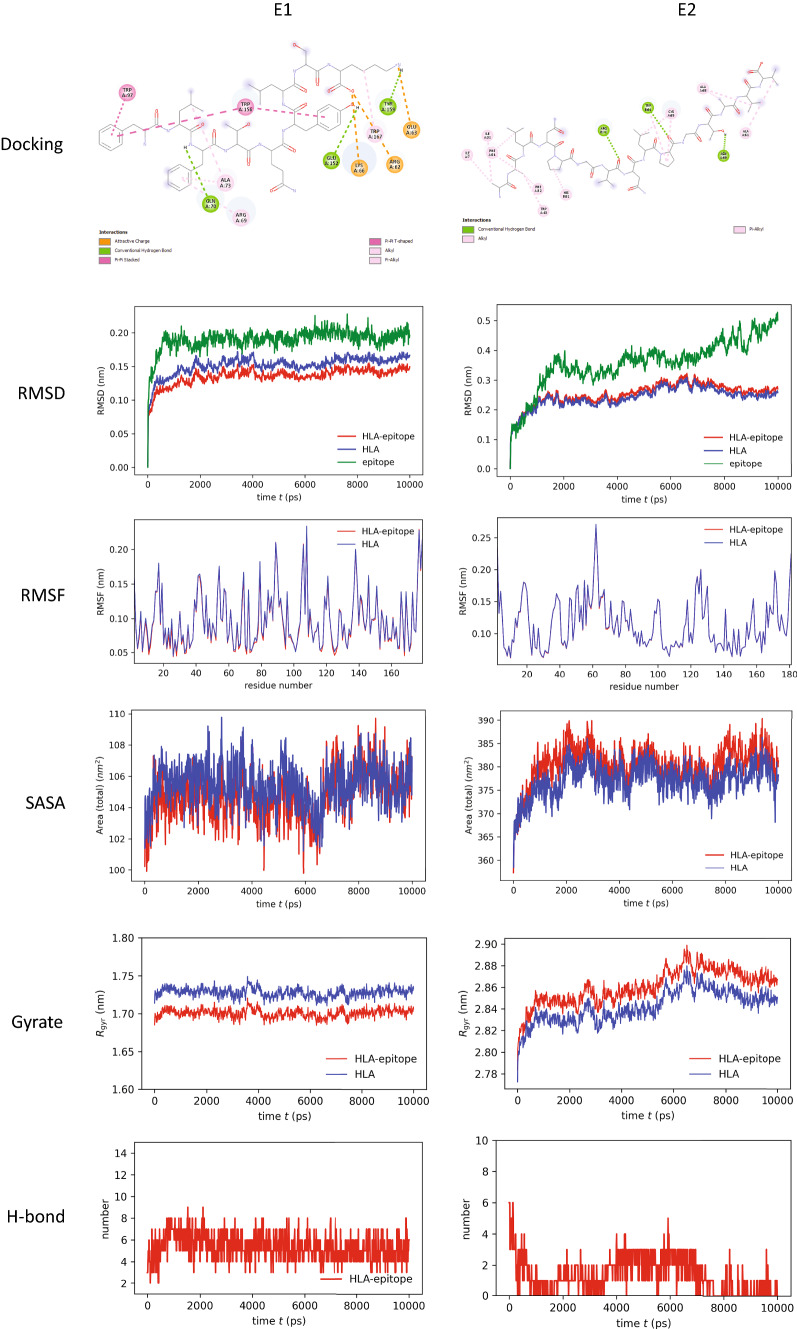
Fig. 2.
Analysis of molecular docking and MD simulation trajectory plots: Bonds between HLA molecule and epitopes (1st row panel). Plot of root mean square deviation (RMSD, 2nd row panel), root mean square fluctuation (RMSF, 3rd row panel), solvent accessible surface area (SASA) with respect to time (ps, 4th row panel), radius of gyration (Rg, 5th row panel), and hydrogen bonds (6th row panel) during MD simulation of MHC-I/MHC-II in complex with respective selective epitope FLFTQYLSK (E1) and AALNPGVNLPGTAVV (E2). Red color indicates HLA–epitope complex, blue color for only HLA and green color for the epitope

