FIGURE 1.
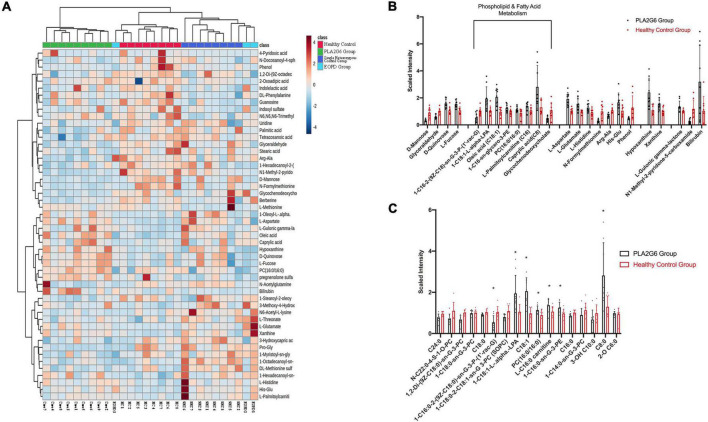
Serum metabolites alterations in PLA2G6 mutation carriers. (A) The heat map of clustering analysis in PLA2G6 Group (green), Healthy Control Group (red), Single Heterozygous Control Group (dark blue), and early-onset Parkinson’s disease (PD) Group (light blue); (B) Comparative mean scaled intensities for the 24 significantly different metabolites between early-stage PD (shaded) and age-matched controls (unshaded), showing standard error of the mean. Highlighted are the eight metabolites associated with phospholipid and fatty acid metabolism; (C) Comparative mean scaled intensities for all the fatty acid metabolites between early-stage PD (shaded) and age-matched controls (unshaded), sorted by the length of the carbon chain. Scaled intensity: peak intensity of each compound is normalized by median. *With statistical significance (p < 0.05).

