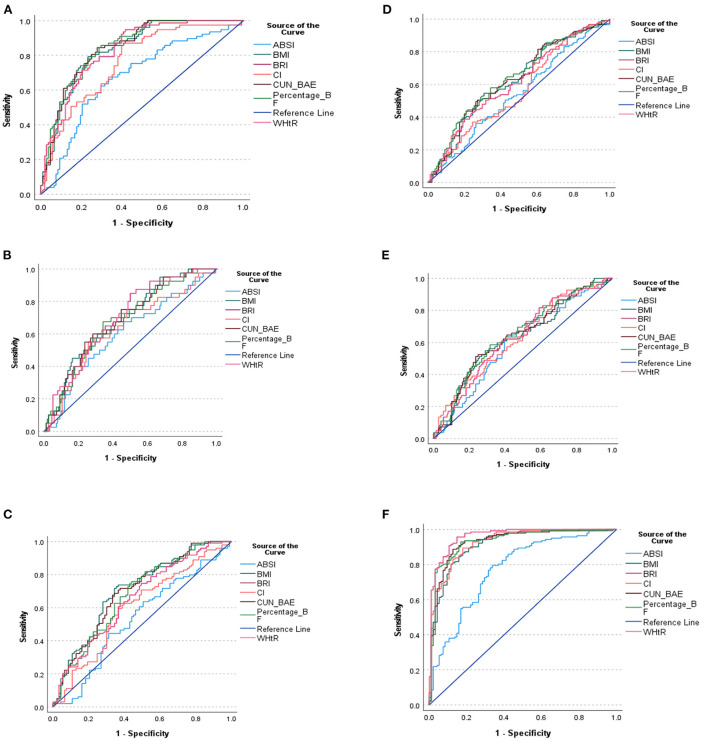
Figure 2.
(A) ROC curve of the anthropometric indices for the prediction of MetS. (B) ROC curve of the anthropometric indices for the prediction of triglyceride. (C) ROC curve of the anthropometric indices for the prediction of HDL-C. (D) ROC curve of the anthropometric indices for the prediction of FBG. (E) ROC curve of the anthropometric indices for the prediction of Hypertension. (F) ROC curve of the anthropometric indices for the prediction of WC. (A–F) shows the ROC curve of the anthropometric indices cut off points for the prediction of MetS and its components.

