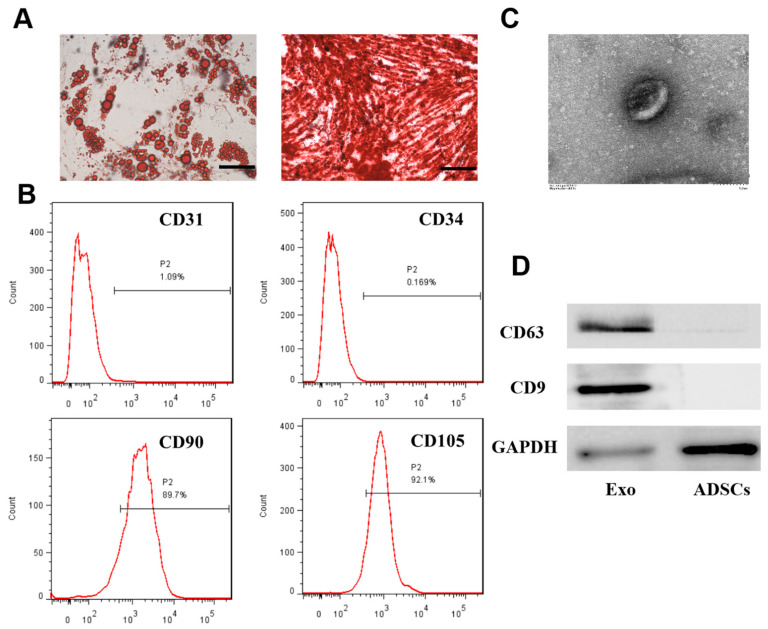
Figure 1.
The identification of ADSCs and ADSCs-exos. (A) Adipogenic and osteogenic differentiation was examined by Oil Red O staining and Alizarin Red S staining (scale = 50 μm). (B) Analysis of ADSCs by flow cytometry. The results showed negative expression of CD31 and CD34 (1.09% and 0.169%, respectively) and positive expression of CD90 and CD105 (89.7% and 92.1%, respectively). (C) Analysis of ADSC-exos morphology by TEM (scale = 100 nm). (D) Western blot analysis of exosome markers (CD63 and CD9).

