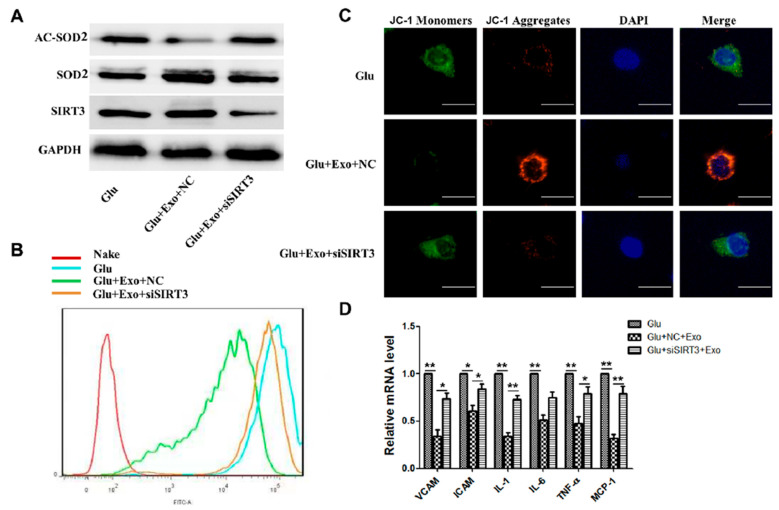
Figure 5.
ADSC-exos exert their effects through SIRT3. (A) Western blot results showing HUVECs AC-SOD2, SOD2, and SIRT3 expression in the high-glucose group, high-glucose+exo+NC group, and high-glucose+exo+SIRT3 group. (B) HUVECs ROS levels were measured by flow cytometry. (C) HUVECs JC-1 signals were measured by fluorescence confocal microscopy (scale = 50 μm). (D) mRNA levels of VCAM, ICAM, and inflammatory cytokines (IL1, IL6, TNF-α, and MCP-1) were analyzed by qRT-PCR. The data are shown as the mean ± SD (* p < 0.05, ** p < 0.01).

